A Simple Macro Regime Tracker
I do not need a complicated macro model to know what kind of tape I am in.
I need a small set of liquid signals that keep me honest. When I am tempted to add risk, I want to know whether the market is rewarding risk broadly, hiding weakness under a few large names, or quietly moving into stress.
Nothing here is financial advice.
The Correction Dashboard
The tracker is a six-symbol correction dashboard: SPY, QQQ, RSP, VIX, HYG, and BTC or IBIT.
That is enough to give me a rough read on the regime. Not perfect. Not predictive. But useful enough to stop me from pretending that every market is the same market.
| Signal | Symbol | What I Watch |
|---|---|---|
| Main market | SPY |
Above or below the 20-day and 50-day moving averages |
| Growth risk | QQQ |
Above or below the 20-day and 50-day moving averages |
| Market breadth | RSP |
5-day and 20-day performance compared with SPY |
| Volatility | VIX |
Above 20 means caution; above 25 means risk-off |
| Credit stress | HYG |
Above or below the 20-day and 50-day moving averages, plus performance versus SPY |
| Crypto risk appetite | BTC / IBIT |
Above or below the 20-day and 50-day moving averages |
SPY tells me what large-cap U.S. risk appetite looks like. QQQ tells me how much appetite there is for growth and duration. If both are above their 20-day moving averages, the tape is usually healthier. If both lose their 50-day moving averages, I do not want to pretend the same playbook still applies.
RSP is the breadth check. It is the equal-weight S&P 500, so it tells me whether the index is being carried by a small group of giants or supported by a wider base. A strong SPY with a weak RSP is not the same as a strong SPY with broad participation.
VIX is the stress gauge. Under 20, the market is usually more forgiving. Above 20, I want less aggression. Above 25, I assume the market is telling me to protect capital first.
HYG is credit risk appetite. Stocks can stay calm while credit starts to weaken. If HYG is below its 20-day moving average for multiple days, or below its 50-day while SPY is still holding up, I treat that as a warning from the plumbing underneath equities.
BTC or IBIT is the speculative liquidity check. I do not need crypto to explain the whole market. I use it as another read on whether capital wants optionality, volatility, and upside.
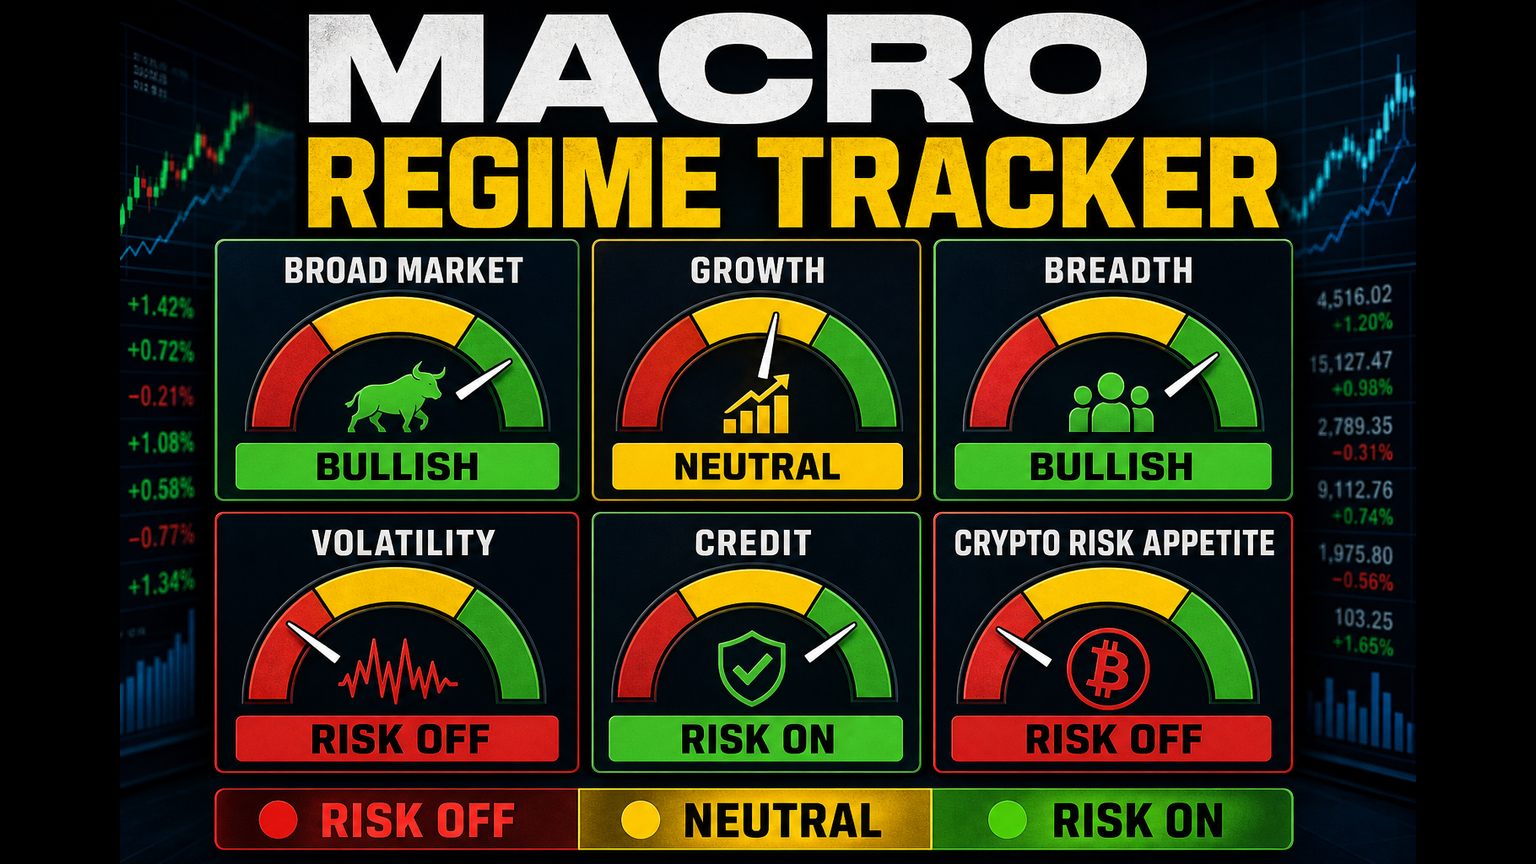
The Traffic Light Rule
I want the dashboard to force a decision posture, not just produce observations.
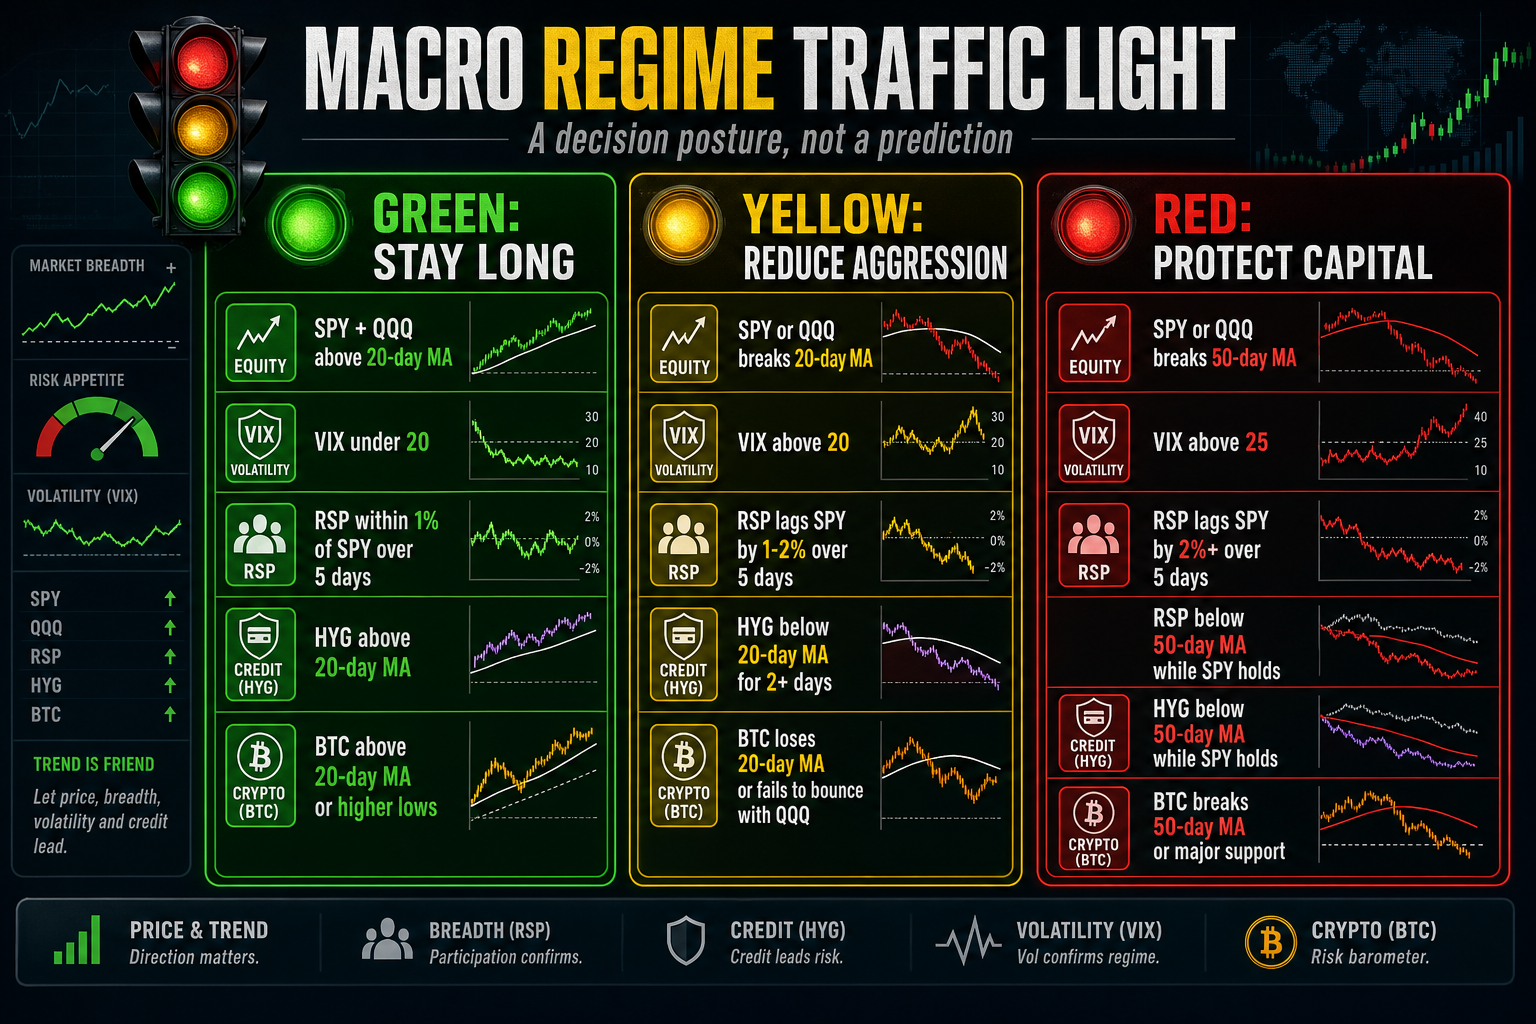
🟢 Green: Stay Long
Green means the market is still giving me permission to own risk.
SPYandQQQare above their 20-day moving averages.VIXis under 20.RSPis within 1% ofSPY's 5-day performance.HYGis above its 20-day moving average.BTCis above its 20-day moving average or making higher lows.
In that environment, I can be more willing to press good setups because the current is moving with me.
🟡 Yellow: Reduce Aggression
Yellow means I do not have to panic, but I should stop acting like the tape is clean.
SPYorQQQbreaks the 20-day moving average.VIXis above 20.RSPunderperformsSPYby 1-2% over 5 trading days.HYGstays below its 20-day moving average for 2 or more days.BTCloses its 20-day moving average or fails to bounce withQQQ.
That is when I want smaller size, cleaner invalidation, and less confidence in broad conclusions.
🔴 Red: Protect Capital
Red means the goal changes from pressing upside to avoiding forced mistakes.
SPYorQQQbreaks the 50-day moving average.VIXis above 25.RSPunderperformsSPYby 2% or more over 5 trading days.RSPis below its 50-day moving average whileSPYis still above its 50-day.HYGis below its 50-day moving average whileSPYis still above its 50-day.BTCbreaks its 50-day moving average or major support.
That does not mean I have to sell everything. It means the market is no longer giving me the same permission structure.
The Point Is Regime Awareness
This dashboard does not forecast the future.
That is the feature. I do not want it to become a prophecy machine. I want it to be a forcing function: before I make a portfolio decision, I have to name the market I think I am operating in.
If the regime is risk-on, I can ask whether my cash drag is intentional or just fear. If the regime is defensive, I can ask whether my urge to buy every dip is discipline or impatience. If the regime is mixed, I can ask whether the position truly deserves capital before the evidence improves.
The market does not owe me a clean signal. Most of the time, it gives partial information and emotional pressure.
So I want a simple ritual. Check the six tickers. Write down the regime. Then make the decision.
The goal is not to predict every turn. The goal is to stop confusing my mood with the market's character.